We use cookies to understand how the website is being used and to ensure you get the best possible experience.
By continuing to use this site, you consent to this policy.
About cookies
Choose from over half a million data variables, and simply click to make a thematic map. Our unique metadata driven system does the rest automatically.
Use maps to identify and precisely select the areas you want in your report. Point and click, draw circles, polygons or lines, or create rings of any diameter around any point to select areas for examination.
Save and reuse your reports, upload standard geographic codes (e.g., FIPS) and download geo selections for later use.
Merge your data with our data to increase your power of analysis and visualization. Our step-by-step wizard will guide you to a beautiful and informative map. You can map any list of addresses such as customers, store locations, organization members, survey respondents, service areas, etc.
Narrow your view to a specific location using our masking feature. Just select the area you'd like to be visible and everything else will be grayed out, providing context without getting in the way.
Easily download large datasets in convenient formats for use in GIS, Excel, SAS, R, STATA or other packages. Data import scripts are included for convenience, and there are no limits on the number of rows or columns you can download.
Social Explorer can automatically adjust dollar amounts for inflation, smoothing out comparisons of income, home value and other variables over time. We employ the same adjustment method used and recommended by the US Census Bureau: bracketed data and the Pareto distribution.
Map any address list in a few easy steps. Built-in state-of- the-art geocoder corrects malformed addresses and uses fuzzy matching to find misspelled ones. It outputs location coordinates, standardized addresses and a precision score, so you'll know exactly what was found. You can also download the results as a CSV or a shapefile.
Identify locations based on search parameters you specify. Use any set of variables in your filter to highlight areas on the map that match your search parameters. For example, you can show all locations that have a certain number of people over 65 years of age and median income over $55,000.
Want a map for your printed report, publication or office wall? You can make it with our high resolution export feature. It allows you to precisely choose the area, the zoom level and the DPI settings, so your map looks exactly right at any size. Your data in high-resolution glory.
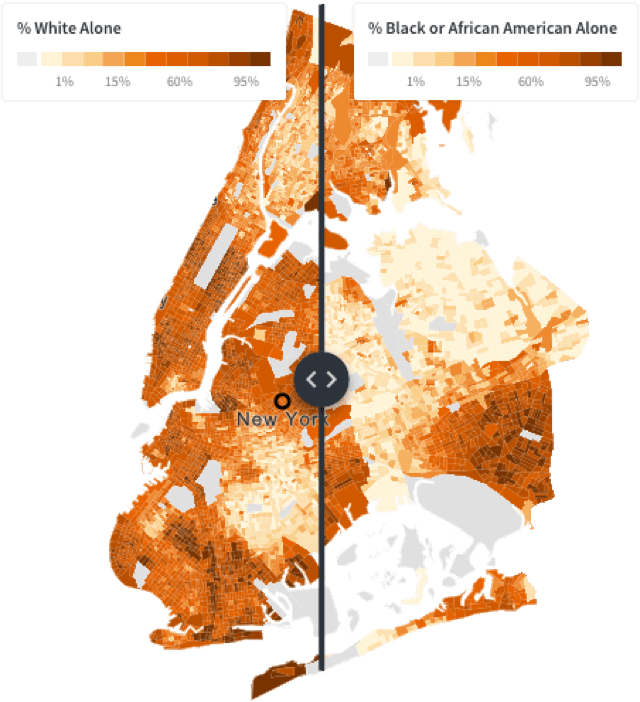
The side-by-side map feature allows you to view two maps at the same time. For example, you can examine how a variable changed over time or examine two variables side by side (e.g. income and education). The swipe feature allows you to dynamically visualize change by "swiping" the mouse back and forth.
Easily select the map layers most relevant for your story. Whether simple border outlines or labels are enough, or you need more detail to give the map context, you can switch layers on and off, ensuring your map looks exactly the way you want it to look.
With multi-variable map feature, you can compare two or more categories directly and visually on a single map. For instance, percent white, black and Latino. You can display this information at the same time using shading, dot density and mouse-over popups.
Leaving nothing unsaid with our many options for annotations. Use text, lines, points, polygons, markers, hotspots, images, whatever it takes to make that statement.
Use the cut points editor to precisely control how data are displayed on the map. You can use one of several built-in methods for classifying data, like Natural breaks (Jenks algorithm), quintiles, equal intervals or custom. You can also save your cut points and reuse them if you like.
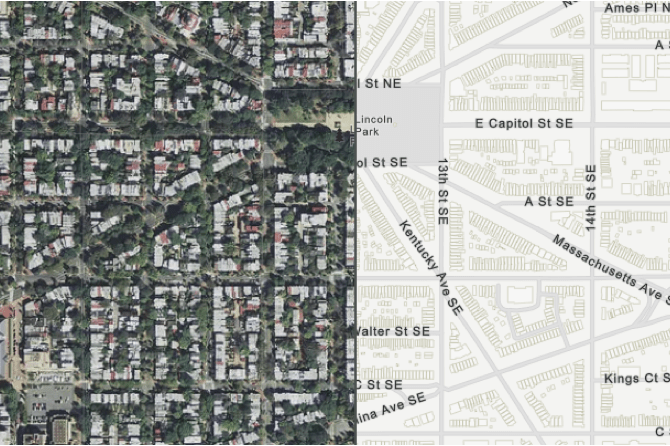
Use satellite and street views to add context and texture to your maps. Social Explorer provides a street map and building footprints from OSM. This allows you to see what’s actually on the ground, with your data laid cleanly on top.
In a few simple steps, you can embed customized data maps on your website or blog to share with the world. Social Explorer is fully responsive and supports mobile devices in embed mode. You can also email and share maps on social media.